We can draw additional stuff on the plot using the bp values we received. We can draw error bars using arrows.
Everything should be a 2 x 2 matrix so things line up properly. If you have errors, check your data!
(x0, y0)is the start coordinate.(x1, y1)is the end coordinate.anglecontrols the angle of the arrow heads: a normal arrow would be closer to 30 degrees, perhaps. If you set it to 90 degrees, it stops looking like an arrow and starts looking like an error bar!code = 3says to plot an arrow like ⟷ and not an arrow like ⟶ or ⟵.length = 0.1controls how big the arrow heads are.col = "salmon"makes them salmon. A lot of color names are accepted as well as RGB hex codes if you want to get creative!
upper.ci <- plot.heights + sqrt(plot.heights)
lower.ci <- plot.heights - sqrt(plot.heights)
arrows(y0 = lower.ci, y1 = upper.ci,
x0 = bp, x1 = bp, angle = 90,
code = 3, length = 0.1, col = "salmon")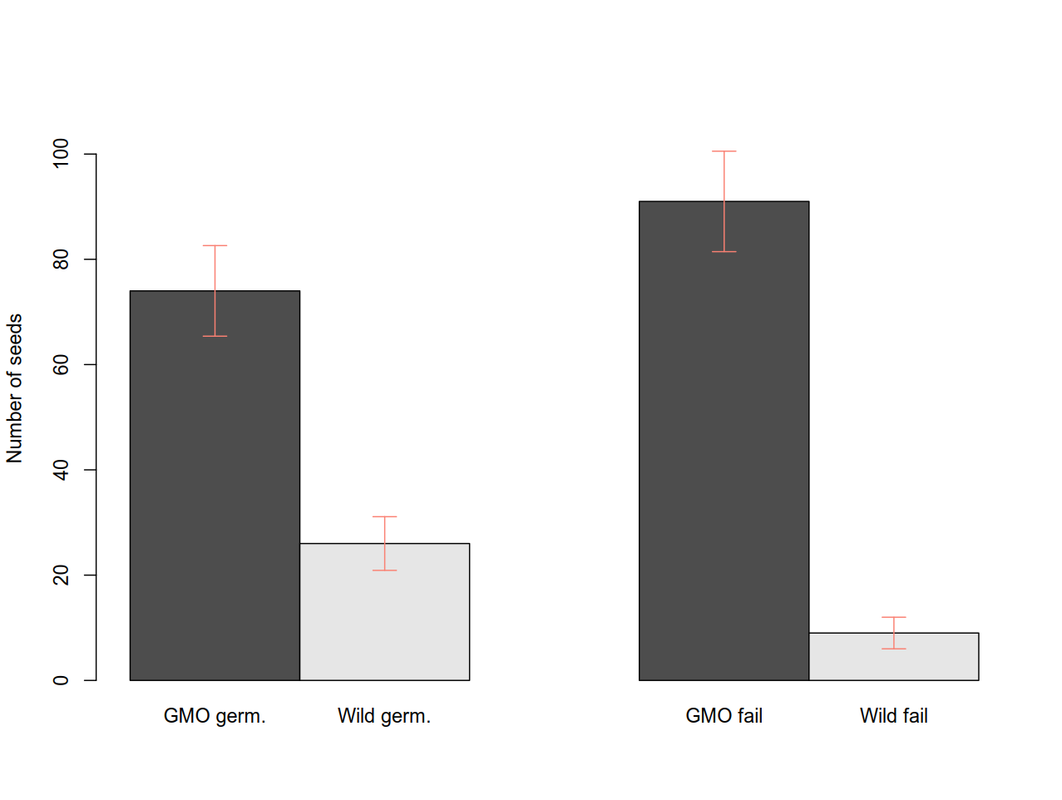